Performance-Monitoring Events
9/Aug 2013
When experimenting with some of the more esoteric features of modern CPUs it’s sometimes not immediately obvious if we’re actually taking advantage of them. Sure, you can compare cycles, but the differences are not always big enough to justify conclusions. Luckily for us, in the Pentium processor Intel introduced a set of performance-monitoring counters. They are model specific (not compatible among different processor families) and allow you to monitor just about every aspect of CPU pipeline. Before explaining the details, let’s take a look at the high level usage steps:
choose events to monitor (from big selection ranging from non-forwarded stores to the number of cache misses. Modern CPUs support up to 4 general purpose counters).
read performance monitor counter (using RDPMC instruction),
run your code,
read performance monitor counter again. Compare with the original one
Doesn’t sound too complicated, does it? The only tricky part is the first step. In order to select monitored events we have to write to Model Specific Register (WRMSR mnemonic). This instruction must be executed at privilege level 0 (kernel), we can’t simply execute it from our application, it needs to be a driver. Sure, we could use a full blown profiler like VTune, that has it built-in, but that’s probably too fancy for our simple needs. Personally, I use MSRDriver by Agner Fog (name should be familiar to any programmer interested in optimization), it’s perfect for small experiments.
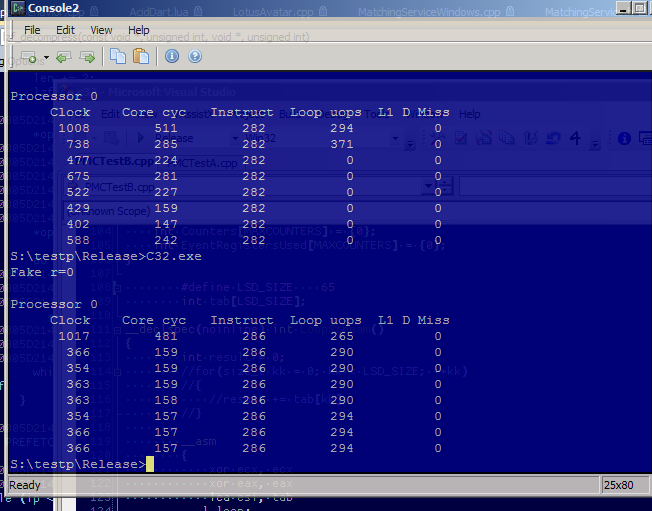
Most recently, I’ve been experimenting a little bit with loop stream detector, but wasn’t sure if it was really kicking in (performance differences were inconclusive). The loop stream detector does pretty much what it says on the tin, if it detects loop that fits in the micro-op queue it starts streaming directly from the queue, no fetching/decoding. It has some limitations, loops can’t be too long (was up to 18 instructions, bumped to 28 in Nehalem), have to have more than certain number of iterations (64), can’t contain too many branches (absolutely no CALLs/RETs) etc. MSRDriver experiments shown below. First run didn’t have enough iterations to qualify for LSD (63), second one had 65. Please notice the third column - the number of micro-ops delivered by loop stream detector (to be honest I’m not exactly sure why it’s non-zero for the first two tests):
Here’s another test, I went back to my store-forwarding experiment (last column is number of loads that could not be forwarded):

Agner’s test app doesn’t include counter definition for Ld.Block, so I added it, here’s corresponding entry:
{312, S_ID3, INTEL_7, 0, 3, 0, 0x3, 0x2, "Ld.Block" },Refer to Intel 64 and IA-32 Architectures Software Developer’s Manual (volume 3B) for a complete list of counters.