MemTracer
19/Nov 2007
As we’re more or less done with The Witcher, I’ve some time (and energy) to do some hobby coding again. Recently I’ve been toying with a new approach to memory allocations tracking. “Traditional” way is to overload new/delete operators, so that they take additional arguments (file+line) then use some preprocessor magic to call them with __FILE__ + __LINE__. Best known example of this approach is probably Paul Nettle’s Memory Manager. I see several problems with this method:
uses preprocessor, requires memory manager header in all files,
doesnt really give enough useful information. In the typical scenario big part of calls will come from Add(Item) or similar function. Ideally we’d like to have full call stack associated with every memory block
adds per-block overhead. There’s a very interesting article on Gamasutra about alternative approach (written by Jelle van der Beek). Read it now, it’s worth it. Basic idea boils down to dividing the task between two applications. Game sends only basic info about memory operations, all the complicated stuff is done by external tool. I decided to implement something similar… Of course it quickly turned out that it’s not as easy as it sounded.
First problem - getting the callstack for every memory allocation. Just use dbghelp.dll, right? Well, yeah, just remember:
to use the latest version of .dll. Right now I’m using 6.7.5.1 and it seems to work OK in most situations. Older versions would always fail at SymGetModuleInfo64 for example.
make sure to fill AddrStack. Some implementations found on the web do it, some dont. I think it worked for me without it with older versions of dll, but with the latest one you’ll only get last callstack entry without it.
StackWalk64 will “work” without symbols loaded, but only in debug version (?). In release the callstack will not be complete. In theory they shouldnt be needed (after all we only want addresses, not exact symbol information), but I couldnt get it to work. In fact, in release build MSVC itself sometimes cannot display correct callstack. When we’ve this one working all that’s left is sending data to external applications. I use sockets (WinSocks) for that, it’s quick and easy. MemTracer application is my first C# program ever, so there may be some stupid mistakes, but it seems to work good enough as a proof of the concept. Main problem with this one was how to retrieve symbols for another executable, given only addresses. Simple way is to use dbghelp.dll again, but this solution has two drawbacks:
the other program has to be running (because we need to pass valid process ID), so it cannot be used for offline analysis,
cannot be used for remote analysis Gamasutra article mentions DIA (Debug Interface Access) as a way to overcome those problems, but that’s it. Fortunately, DIA turned out really easy to use. The only problem is that for some reason I couldnt get it to work from Delegate called by Control.Invoke. Quick solution was to retrieve symbols before and cache them (it’s quicker anyway, since we ask for them several times). In provided source code you can switch between both solutions (DbgHelp & DIA, DIA is obviously preferred). Below you can find the snapshot of my sample application:
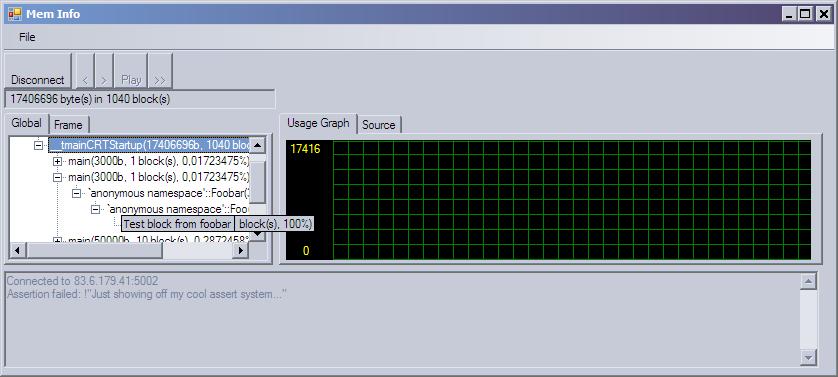 The functionality is rather simple, but it can be easily extended now, that core is in place. You can save frame-by-frame information for later offline analysis. For usage graph I used C2DPushGraph control by Stuart Konen. Obvious improvements would be:
leak detection
graphical heap(s) view (to control fragmentation)
support for multiple heaps (can be done quite easily with existing ‘tag’ system) I’ll just leave it as an excercise for the reader :). Without further ado – go get source code here and have fun! PS. In case you’re wondering what are those .bdgcfg files - they’re config files for excellent BadgerConfig system by Jim Tilander.