Simple instrumenting profiler
1/Aug 2008
For every bigger project, sooner (if you’re wise) or later (if you’re, errr, not that wise) comes a moment when you need to answer yourself one very important question: ‘why the hell is it so friggin’ slow?!?’. Most common methods for determining bottlenecks in games/demos evolved with time. Back in eighties/early nineties, when we were young, restless and beautiful, the most common method was counting scanlines. Those were the times when we were not really interested in finding out how many frames per second we’re running. It was taken for granted it’s full framerate (50/60/whatever) anyway, otherwise you’d be laughed at and have your programmer’s license revoked.
Instead, we wanted to know what parts of our code take the most frame time. It was pretty easy to visualize - all you had to do, was to change border color (some fun with port 0x3C0) in functions you wanted to profile. Say (pseudocode):
void Animate()
{
    SetBorder(GREEN);
    // Animate
}
void Render()
{
    SetBorder(BLUE);
    // Render
}
Timing was given in number of scanlines rather than ticks or milliseconds (say, Animate took 50 scanlines and Render - 150). You’d instantly see what your main bottleneck is. It was very simple, but worked OK.
Nowadays, it’s more common to have all kinds of built-in hierarchical profilers. Let’s take Ogre Profiler class as an example:
void Animate()
{
    OgreProfileBegin("Animate");
    // Animate
    OgreProfileEnd("Animate");
}
void Render()
{
    // Alternatively
    OgreProfile("Render");
    // Render
}
Usually you provide macros for profile begin/end, so it can be disabled/enabled globally. Functionality depends on implementation, but it should at least show you timings for profiler blocks. In more useful versions you’ll have call counts and some hierarchical info (so you know that RenderCharacters() takes 30% of your Render() function for example).
One problem with this solution is that it requires constant code modifications. Every time you want to profile a function/block - you need to modify your source code. It’s not always immediately obvious what’s actually main culprit, as it may not be included in our profiler. Animate() takes 20%, Render takes 20%, where the hell is our 60%? Wouldnt it be cool to profile everything? Every single function that we call, so we dont have to worry about missing something. Of course, we can use external tools like VTune, but usually they are: a) not free (as in expensive), b) slow (try loading big level under VTune, you’ll know what I mean). It’s still good to have them around for some more detailed analysis, but let’s try something simpler, just for a quick overview, before drilling further. If only we could somehow inject our code at the beginning/end of every function in our program… It turns out that we actually can. (under MSVC).
Just compile your project with /Gh (call the _penter at the start of every method/function) and /GH (call the _pexit at the end of every method/function) switches. Then, you also have to provide _penter/_pexit functions, otherwise the linker will complain about unresolved externals. They both should be ‘naked’ (no dirty thoughts there! Those are functions without prolog/epilog code, you’ll have to provide them yourself) functions and have C calling convention. All that’s left know is to measure how much time does our function take, emit some other useful info and store it somewhere. In my simple version every entry consists of: ID, function address, recursion depth, parent function, ticks taken. I save this info to binary file and have external C# program perform analysis. Below you can see results of sample profiling session. It happens to be my RDE STL unit test (tons of function calls) and the profiled code didnt require single modification!
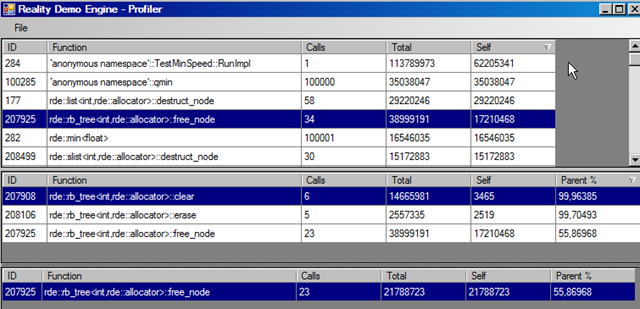
It’s pretty much same view as in VTune - all functions in top panel, two panels in the bottom. One shows callers of selected function (free_node), another shows children, both with hierarchical info (free_node takes 99% of clear, it also recursively calls itself). It’s obviously very simple, but shows the possibilities of such system, it has been done in about 30 minutes. What are the problems with our profiler?
it profiles everything. That’s what we wanted, right? Well, yeah, but it can take lots of space. It’s best to provide a way to enable/disable it on the fly. Also, you could probably easily remove recursion depth/ID without loosing much information (it’s left from older version, where I was extracting parent from that info, but it turned out to be too slow anyway, so it’s saved now)/employ some other tricks to reduce size of single Profiler entry,
it’s harder to provide realtime preview (comparing to hand-coded profiler).
it’s problematic to make it work in multi-threaded environment. In my implementation it can only be enabled for one thread at any given moment (took some experiments to access TLS data from assembler, but it seems to work). It’s enough for my purposes, I simply profile thread-by-thread.
That said, it may be another useful tool in your box. Normally, you probably would want to use “standard” profiler for day-to-day analysis, use instrumentation for wider view and finally fall-back to heavy cannons like VTune or CodeAnalyst if everything else fails.
Profiler source code can be downloaded here: Profiler.h, Profiler.cpp. It wont compile as-is, but should be quite easy to extract core functionality. One unclear part may be WriteSamplesToDisk function. It needs to know some information about debugged application (PDB name module base address, module size), otherwise it would be hard to translate function addresses -> symbol. Enjoy!
[Edit] As noticed by JT in comments, link to Profiler.cpp was wrong, fixed now.
Old comments
ed 2008-08-01 22:14:14
That is a great feature. I can’t profile our latest game because it crashes PIX, PerfHud and VTune during callgraph so it’s incredibly hard to profile.
Other downside of this method is that you still need to recompile the code if you want to completely remove it or add it to the program.
admin 2008-08-02 09:16:53
That’s true, but it’s also the case for all custom profilers, where you usually have to switch some macro (PROFILE_ENABLE or whatever). An alternative is to have Profile build configuration next to “normal” Debug/Release etc. (that’s how I actually have it for my home projects).
PS. “Friendly” game you’ve there, BTW :)
JT 2008-08-03 18:16:10
Profiler.cpp link is wrong. Just an FYI.
js 2008-08-04 08:44:37
I can see where you got inspiration :)
This look more PIX than VTune to me but nice interface, I am planning to do the same :)
SpecialK 2012-01-25 22:14:44
Why do resort to lengthy ASM code in your “_penter” and “_pexit”?
I would think it would be much easier to just make minimal call stub to your C/C++ functions.
I.E:
void stdcall MyCEnter(UINT_PTR uReturn)
{
… do something
}
extern “C” void __declspec(naked) _cdecl _penter(void)
{
_asm
{
pushad
; Pass return address
mov eax,[esp + (4 * 8)]
push eax
call near MyCEnter()
popad
retn
};
}